


Next: Annex: Variance of Sullivan
Up: From a complete life
Previous: The last interval
Often, the prevalence ratios of disability (for example) by single
years of age show considerable fluctuations due to sampling
variations. Thus, it is preferred to use average prevalence ratios for
a five or ten years age interval for Sullivan method. It implies to
estimate the total years of life lived in such age intervals. There
are two possibilities:
- The use of a classical abridged life table. An abridged life
table contains columns similar to those of the complete life table;
the only difference is the length of the intervals. The length of a
typical interval
 in the abridged life table is
 , which is greater than one year. Formulae
from 9 to 13 can be extended in that case.
, which is greater than one year. Formulae
from 9 to 13 can be extended in that case. - The use of an abridged life table with values of
 derived
from the life table (i.e.
derived
from the life table (i.e.  ) and values of
  calculated
by summing values of
calculated
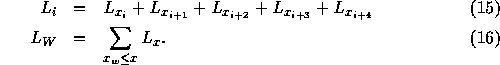
by summing values of  for single years of age x from the
unabridged life table. In the example above (see 1.3),
were calculated with the following formulae:
for single years of age x from the
unabridged life table. In the example above (see 1.3),
were calculated with the following formulae:
Because the second method is generally more accurate, it is highly
recommended to use it if possible.
Eric Hauet
Fri Apr 25 22:40:35 DFT 1997